If you are reading this, then you are probably fortunate enough to have a little money in your pocket this holiday season. I'd like to pass along a worthy Pomona organization that I just learned about. Pomona Hope is currently accepting donations of books, games, computer mice and, of course, cash. Check out their website, although the stats on poverty in Pomona seem overly bleak -- so perhaps our stat's guy Ed will weigh in.
Please note that I have no affiliation with this organization, which is a non-profit, nor am I even Presbyterian. It sounds like Pomona Hope is doing something very noble down on Holt. And it doesn't sound like they have too much of a religious agenda.
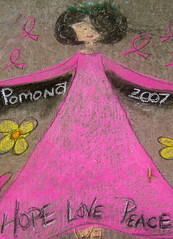
Today's photo is art work from the recent Aztlan Chalk Art Festival in Pomona. I am thinking that this is either some child's rendition of the Goddess of Pomona, or of a kindler, gentler Mayor Torres.
THE END
2 comments:
I'll take a stab at this.
Median family income
They say $30000, but actually it's $41,000. The median income for females is $26,000, but I don't know if that applies to families headed by females. By comparison, Claremont's median family income is $78,000 and full-time female income is $38,000.
Poverty level
They are right, 22% of the pop is below the poverty level, 17% of families are below.
Housing (rent vs own)
These numbers are correct, 57% own 43% rent (Claremont is 67% and 33%). Lots of apartments vs condos, I guess. Should we support condo conversions?
Racial demographics
I have approx. 17% anglo, not 9.6%
Couples heading families:
70% of families with children under 18 are lead by married couple, not 54.6% (Claremont is 75%).
Households without father nor mother (20%)
I think they really goofed on this one. I can only approx. that number if I look at adults not living with their mother or father. For my estimates of Pomona, 10% of children live with relatives and for comparison, 7% in Claremont.
I won't comment on the crime and education numbers because of their dynamic nature...and I'm tired.
I can't comment on their "poorest section" of the city, since they didn't provide a specific location. In their defense, the census data isn't easy to decipher (so you may want to check my numbers). I do want to add that this pastor is commonly quoted in the newspaper, so I hope he isn't slanting the data to support an agenda.
Perhaps the real lesson we should derive is how our perceptions may lead us to misread/misinterpret data. We all do it. Is Pomona a crime-plagued, poor city, or is it an economically and racially diverse, urban city? I'm going to use David Allen's rose-colored glasses for this one.
Btw, I relied on 2000 census data.
Just for reference
Pomona
Median income: family $41000 female $26000
Poverty: 22%population 17% families
Housing: 57% own 43% rent
Couples heading families:70%
Households w/o father nor mother:10%
Upland
Median income: family $57000 female $30000
Poverty:12% population, 9% families
Housing: 59% own 41% rent
Couples heading families: 67%
Households w/o father nor mother:8%
Ontario
Med income: family $44000 female $26000
Poverty:16% population, 12% families
Housing: 58% own, 42% rent
Couples heading families: 70%
Households w/o father nor mother:10%
Pasadena:
Med Income: family $54000 female $36000
Poverty: 16% population 12% families
Housing: 54% own 46% rent
Couples heading families: 68%
Households w/o father nor mother:9%
Post a Comment